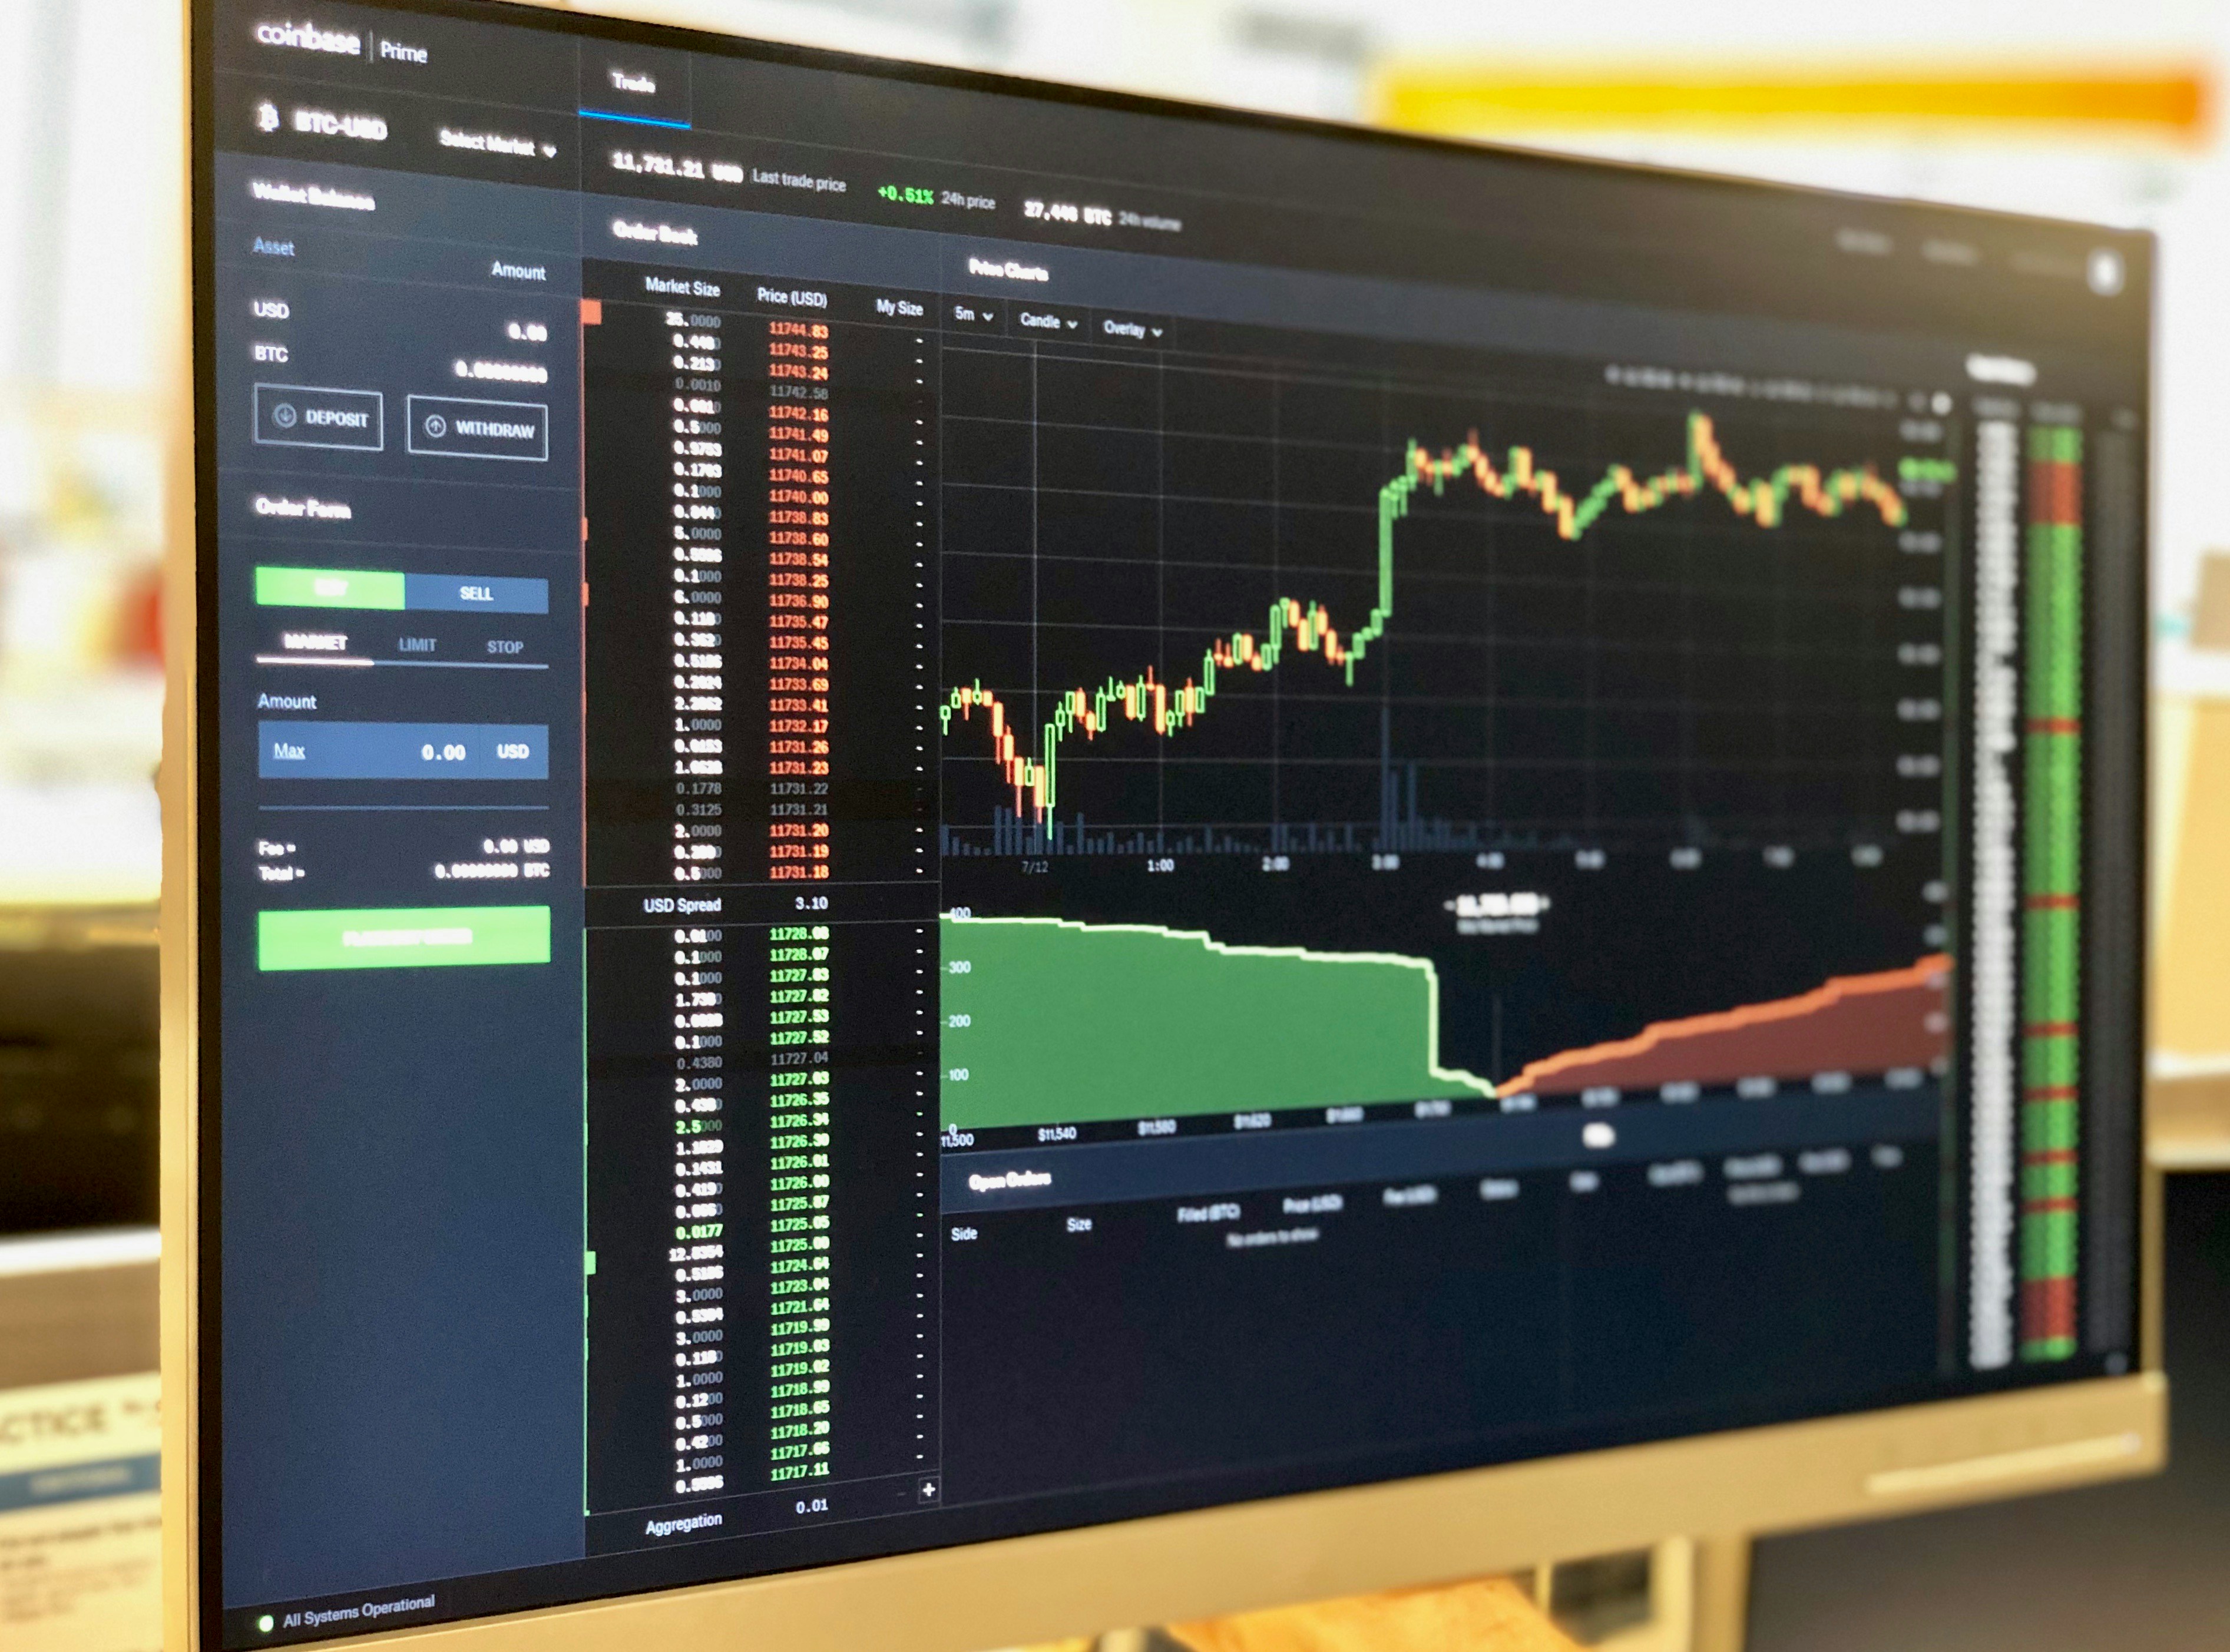
Bitcoin (BTC) has once again captured global attention as it surges past the $109,000 mark. The cryptocurrency market is brimming with excitement, and traders are wondering: Is this the beginning of another bull run or a bull trap in disguise?
In this blog post, we’ll dive deep into BTC/USDT’s 1-day chart from OKX, exploring the price action, moving averages, volume, patterns, and potential trading signals to help you make informed decisions.
📊 Quick Snapshot – BTC/USDT on 1D Timeframe
| Metric | Value |
|---|---|
| Current Price | $109,807.7 |
| 24h Change | +0.38% |
| Volume (BTC) | 105.3k |
| MA5 | $108,631.6 |
| MA10 | $108,317.1 |
| MA20 | $105,935.6 |
| Recent High | $111,987.0 |
| Support Level | $105,000 |
| Resistance Level | $112,000 |
🔍 1. Trend Overview – What the Chart Shows
🟢 Uptrend Confirmation
Bitcoin has been in a strong bullish trend since mid-April 2025. The price action shows:
- A clear higher high and higher low structure.
- MA5, MA10, and MA20 all sloping upwards—indicating momentum is bullish.
- A sharp parabolic move from ~$82,000 to over $109,000 in less than 6 weeks.
📈 Price Channels and Patterns
- The current price is well above the MA20, suggesting overbought conditions.
- A potential ascending channel is forming.
- A small doji candle at the top may signal temporary indecision.
📉 2. Technical Indicators & What They Say
h3: Moving Averages (MA)
- MA5 ($108,631) and MA10 ($108,317) have crossed above MA20 ($105,935), forming a Golden Crossover – a strong bullish signal.
- The short-term price remains above all moving averages, signaling buyers are in control.
h3: Volume Analysis
- Volume has remained consistently above 100k BTC in the past week.
- A volume surge without price drop implies accumulation rather than distribution.
h3: Relative Strength Index (RSI) [Not visible, inferred]
- Based on the parabolic rise, RSI is likely above 70, indicating overbought territory.
- Traders should be cautious of a possible correction or sideways movement.
📉 3. Key Levels to Watch
h4: Support Zones
- $105,000 – $106,000: Strong support zone near the MA20.
- $98,000: Previous resistance now acting as a secondary support.
- $90,000: Psychological level and previous breakout zone.
h4: Resistance Zones
- $111,987: Recent local high.
- $115,000: Likely target if momentum continues.
- $120,000: Psychological milestone and potential blow-off top.
📈 4. Potential Trade Setups & Signals
h5: For Long Traders (Bullish Bias)
- 📌 Entry: On a pullback near $106,000 – $107,000 (MA10/MA20 bounce)
- 🎯 Target: $112,000, $115,000
- 🛡️ Stop-Loss: Below $105,000
h5: For Short Traders (Bearish Bias)
- 📌 Entry: On bearish confirmation candle near $111,000+
- 🎯 Target: $102,000, $98,000
- 🛡️ Stop-Loss: Above $112,500
⚠️ 5. Risk Management Tips for Traders
- Use 1-2% risk per trade rule to manage exposure.
- Don’t chase green candles—wait for confirmations.
- Diversify instead of putting all funds into BTC.
📊 6. Historical Price Context
| Date | Price Low | Price High | Trend |
|---|---|---|---|
| Oct 2024 | $52,522 | $76,000 | Bullish |
| Jan 2025 | $74,000 | $106,000 | Bullish |
| Mar 2025 | $76,000 | $86,000 | Sideways |
| May 2025 | $82,000 | $111,987 | Bullish |
🌐 7. What This Means for Crypto Investors
- Long-term HODLers can enjoy the ride but should prepare for volatility.
- Short-term traders need to be cautious of FOMO-driven entries.
- Institutional interest is likely behind such strong moves, indicating further upside potential.
💬 Expert Insights
“Bitcoin is showing strong institutional footprints. The chart’s parabolic structure may lead to a minor correction, but overall momentum remains bullish unless $105K support breaks.“
— Crypto Analyst “SunnyTrades”
✅ 8. Summary – Signals to Note
- ✅ Golden Cross between MA5, MA10 & MA20
- ✅ Higher high and higher low formation
- ⚠️ Potential overbought RSI
- 📈 Target: $112,000 – $115,000
- 🛡️ Key Support: $105,000
📌 Final Thoughts
Bitcoin continues to flex its muscles with a sharp upward trend, crossing critical resistance levels and setting new short-term highs. While the current setup is undeniably bullish, smart traders know that momentum doesn’t last forever—discipline and risk management are key.
Whether you’re planning to HODL or swing trade, keep your charts updated, stay informed, and never invest more than you can afford to lose.
🔗 Join the Action: Trade on OKX with this referral
👉 okx.com/join/69111232


